Mapping Motion with Sensors
Mapping Motion and Direction with Sensors
Calibrating Your Compass
A blog post explaining the figure-8 movement
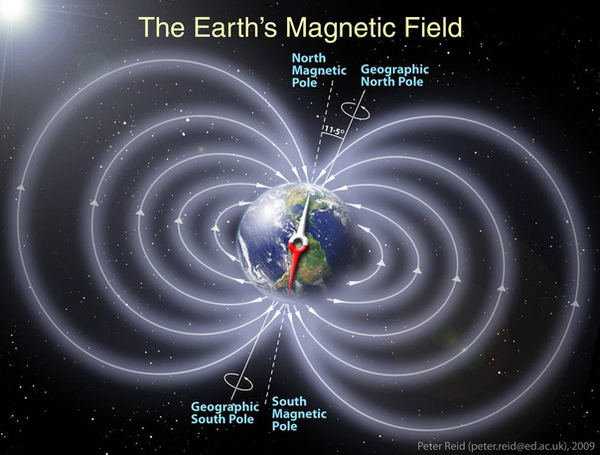
You might have noticed the sometimes the compass on Physics Toolbox apps require calibration (or any app that uses a compass, for that matter). Although we now include a special notice for users when we anticipate it needs to be calibrated with instructions on how to do so, few resources are available that explain exactly how this works...
New Barometric Altimeter Setting
Using Local Sea Level Pressure to Measure Height and Motion
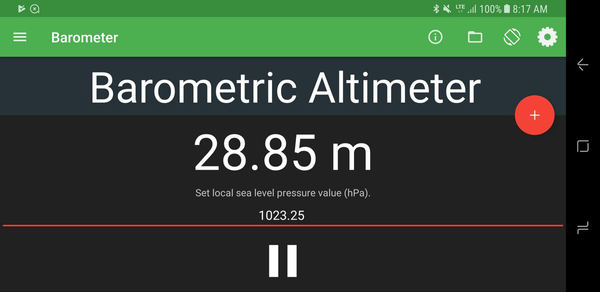
Both Physics Toolbox Sensor Suite and Pro now include a new option under the "Barometer" mode. By accessing settings, users can select "Barometric Altimeter" to get an estimated height above sea level. To ensure accuracy, local sea level pressure must be entered -- this is dependent upon current weather conditions, and can change from hour to hour, or more frequently. To access your local sea level pressure, visit Weather.gov's Weather Data page.
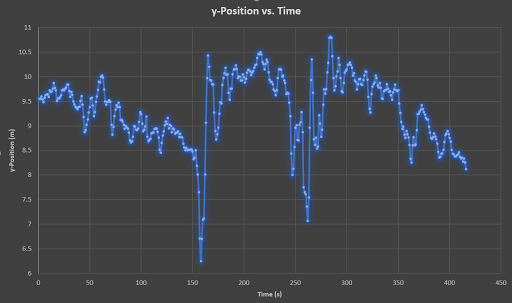
While we encourage individuals using the barometric altimeter setting to first help students understand air pressure and height relationships, the barometric altimeter can be very helpful in the study of basic motion. One of the first experiences physics students often have is to do "motion mapping" using sonic radar devices. However, with the barometric altimeter, students can now make sense of vertical motion by moving their mobile device in the single y-dimension, predict the shape of the graph, and then check with a data analysis tool. The graph below shows one example of segmented motion: (1) moving downward slowly, (2) moving upward very quickly, (3) holding approximately still, (4) moving down and up fairly quickly, and (5) moving down slowly.
Eclipse 2107
Data Using the Light Meter
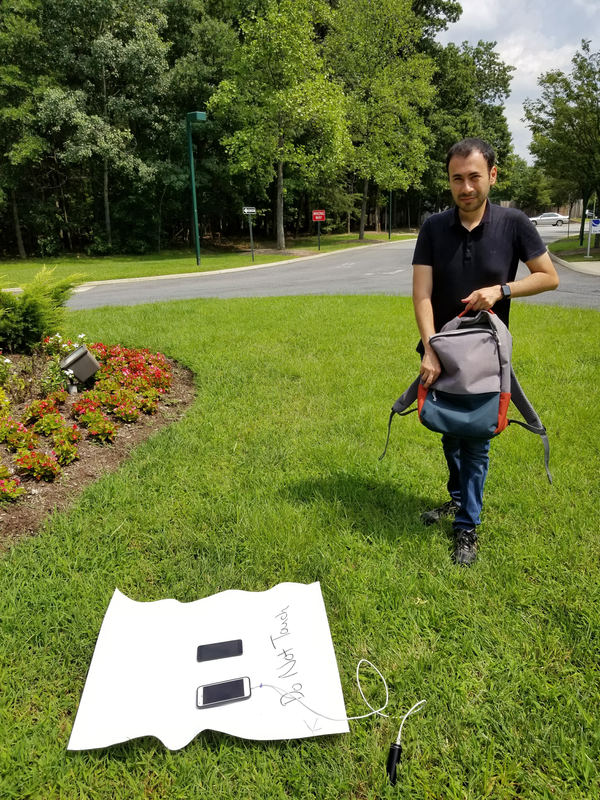
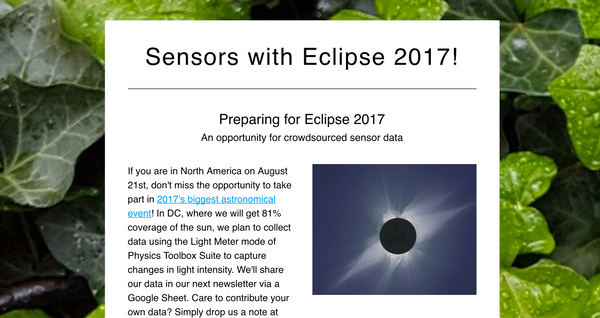
The eclipse reached nearly 80% coverage of the Sun just outside of Washington, DC. While we had too much cloud coverage to get meaningful data from our light intensity readings, we were lucky enough to get data from a user who was in the path of totality! Click on the link below to see a spreadsheet of data from user Ken Erickson while in St. Charles, Missouri.
New Tutorial and FAQ Pages
Have you maximized your learning with Physics Toolbox? It's easy to overlook many of the embedded features, so visit the Tutorial page and check out the FAQ Categories. The new information pages include the following:
- Sensor & Generator Information
Information about how each of the sensors or detectors work. This is the same information that can be found in the (i) button in the top menu bar of each sensor/generator mode.
- Settings
Information about what can be found in the "cog" button in the top menu bar of each sensor/generator mode. This includes information on how various data filters and calibrations work.
- Teaching and Learning with Sensors
Links to our favorite resources about lesson ideas (including detailed blog entries).
If there is anything missing on our FAQ's page, please let us know!
Physics Toolbox in the News
We are always curious to learn about how Physics Toolbox is being employed in education and industry around the world. Here are a few snippets!

Physics Toolbox Magnetometer was used to help identify the cause of a man overboard (MOB) alert that caused the U.S. Coast Guard to scramble after a ship with activated sensors.
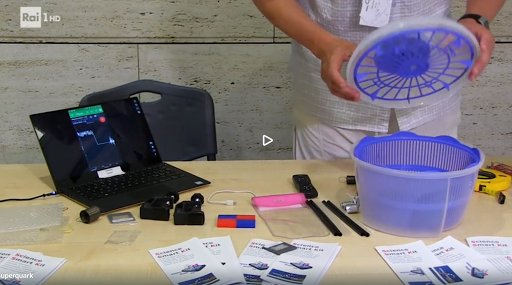
Physics Toolbox was included in the "Science Smart Kit" project presented at Science on Stage's annual gathering in Hungary. The project was awarded the "Highly Commended" rating and featured on Italian national television.
Have Physics Toolbox Apps been useful to you? We'd love to get your feedback on this quick 5-minute survey.
Have a great story to share about how you are using Physics Toolbox Apps? We'd love to feature you and your ideas in our newsletter or on our website! Drop us a message at any time to share your story.
Previous Newsletter Editions