AR and Manual Graphs with Physics Toolbox
AR and Manual Graphs with Physics Toolbox
New Features: Data Entry and Play in Suite and Pro
We know that many of our users have been looking for an all-in-one graphical analysis solution for their mobile devices. Manual data entry and graphing is especially important for data that cannot be easily collected with internal sensors but can be measured by other means, such as position measured with a meter stick, or to plot data that are not time-dependent. Suite and Pro currently allow up to 8 data points. (Note that y-axis labels currently do not display, but can be inferred from the title. This will be resolved shortly). Look for future modifications, which will include significantly expanded data point entry in Pro, and the ability to remove the "connect-the-dot" feature.
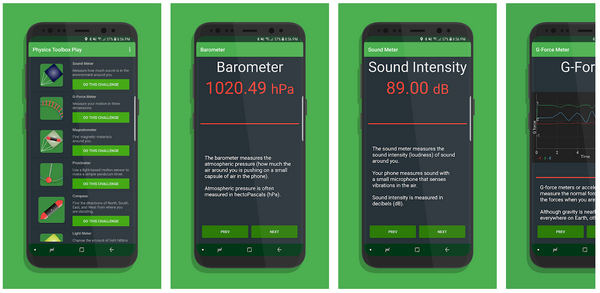
You might have heard of Physics Toolbox Play, an app funded by the American Physical Society that introduces you to sensors and STEM careers through seven data-validated challenges. Formerly a stand-alone app, Physics Toolbox Play is now integrated into Suite and Pro near the bottom of the mode menu.
NSF Awards $328K for Researcher on Data Visualization with Physics Toolbox

The National Science Foundation (NSF), one of the worldwide leaders in science and science education funding, has awarded $382,689 to the American Modeling Teachers Association in coordination with Vieyra Software and a team of educational researchers, science educators, and scientists to advance data visualization tools and research their use in student learning. In this project, Vieyra Software will aim to use novel augmented reality (AR) technology to develop a sensor-based magnetic field visualization tool to address common student struggles in 3-D visualization.
Inside Your Mobile Device
In the process of learning about sensors, we've learned a lot about digital electronics. You can always learn more on our Tutorials page. Here are some great video resources that will give you some insight into what's going on!
Accelerometer, Gyroscope, and Magnetometer
Most smartphones rely heavily on three sensors that are integrated into the inertial measurement unit, a single chip on the electronics board. In addition to the Learning Accelerometer, Gyroscope, and Magnetometer modes within Physics Toolbox, data from these sensors are used in the G-Force, Roller Coaster, and Compass modes.
Barometer, Hygrometer, and Thermometer
While most phones only have a barometer chip, some have a holistic "weather unit" that includes a hygrometer and thermometer.
Touch Screen
Nearly all human interactions with mobile devices occur through touch, and the screen has a special role to play in the Ruler mode of Physics Toolbox.
Physics Toolbox Around the Web

Check out "Scientific Investigation through Innovative Use of Mobile Devices in the Playground" in the June edition of the Australian Science Teachers Association's Teaching Science. The authors use double-sided sticky tape to attach a smartphone to a playground swing for pendulum studies.
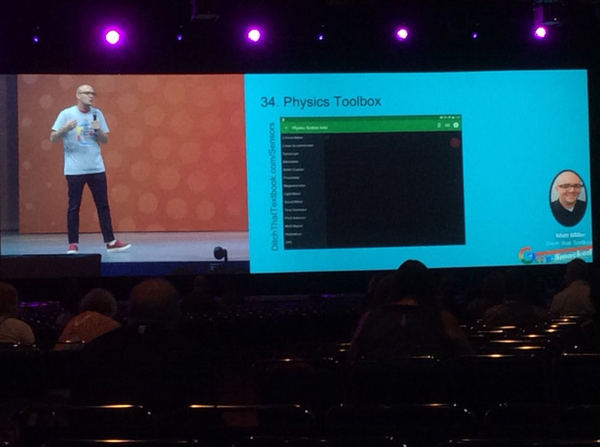
Digital educator and innovator Matt Miller, author of Ditch that Textbook, keynoted at the International Society of Technology Education on June 27th, and featured Physics Toolbox.
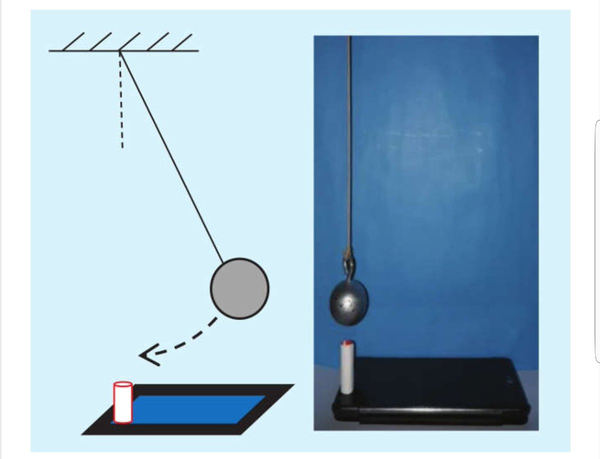
This Italian-language article looks at modulations in light intensity as a pendulum swings over the photosensor, and shows how to calculate acceleration due to gravity.
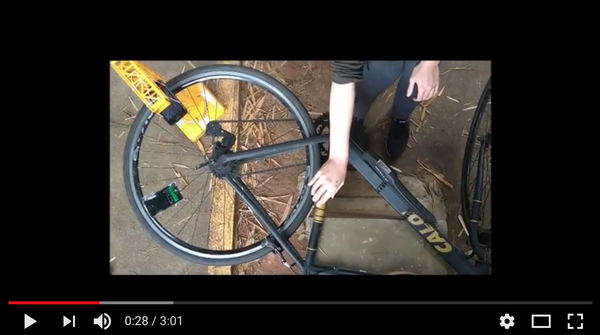
We love seeing students interact with smartphone sensors. The following are a number of videos from a Computational Modeling and Simulation course in Brazil that takes place each semester.
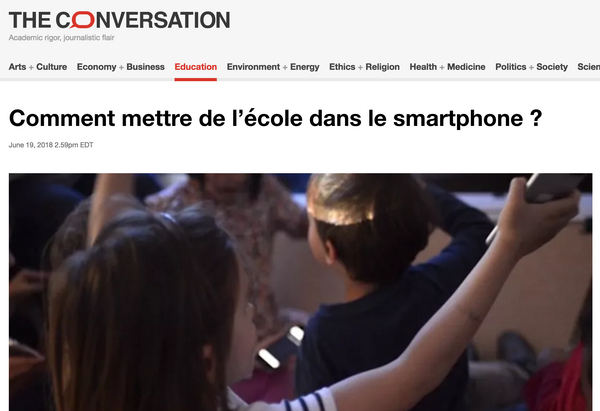
Technology does sometimes cause tension in the classroom. Some teachers, however, emphatically believe it has an appropriate place. Read this French article from colleague and fellow smartphone app developer Joel Chevrier.
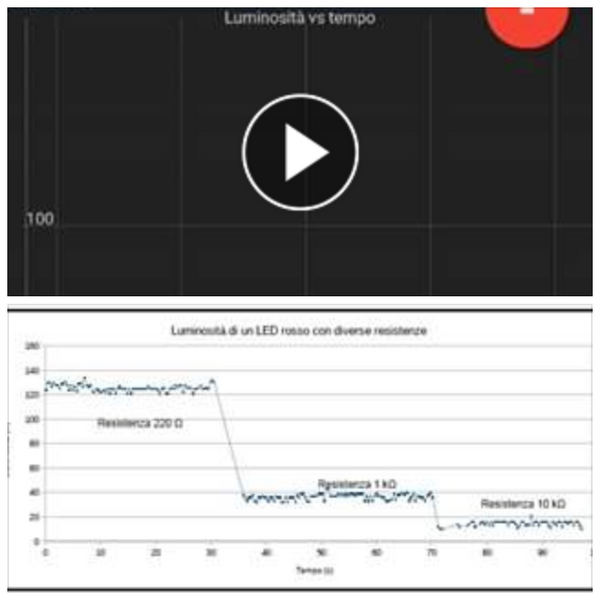
Smartphones can be quasi-ammeters. All you need is a variable LED to correlate its circuit's current to light intensity output, sensed by the light meter. Read about it in this Italian-language post.
Previous Newsletter Editions
Have Physics Toolbox Apps been useful to you? We'd love to get your feedback on this quick 5-minute survey.
Have a great story to share about how you are using Physics Toolbox Apps? We'd love to feature you and your ideas in our newsletter or on our website! Drop us a message at any time to share your story.