
settings
Settings
Each tool has its own Settings screen, opened from the gear icon in its toolbar. Most share three groups, Measurement, Graph, and Recording, plus Class View where it’s supported.
Measurement
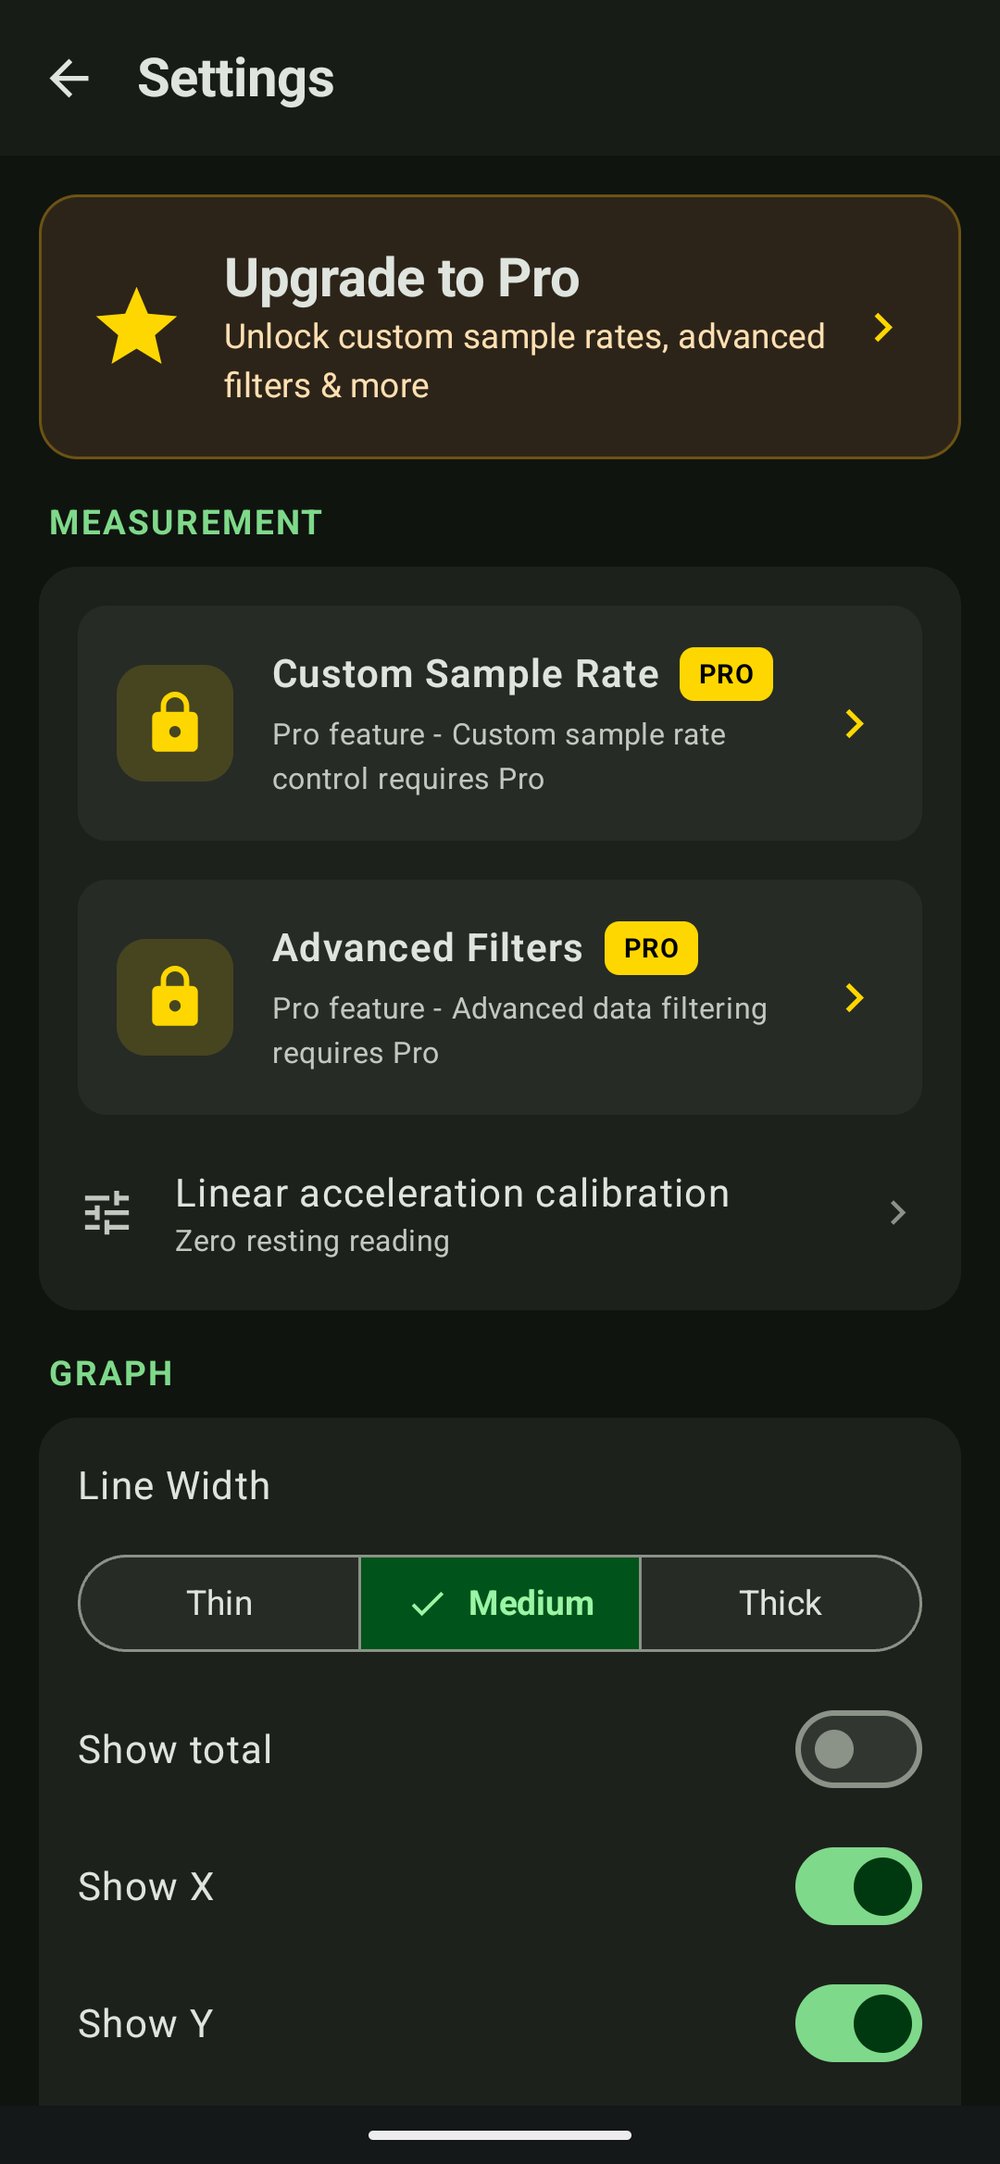
- Custom Sample Rate. Set exactly how many readings per second are recorded, up to the sensor’s maximum. Requires the Pro upgrade.
- Advanced Filters. Choose No Filter, Kalman Filter, Low-pass Filter, or Moving Average to smooth noisy data, each with its own strength setting. Requires the Pro upgrade.
- Calibration. Zero a sensor’s resting reading, on the tools where that applies (for example, Linear Accelerometer).
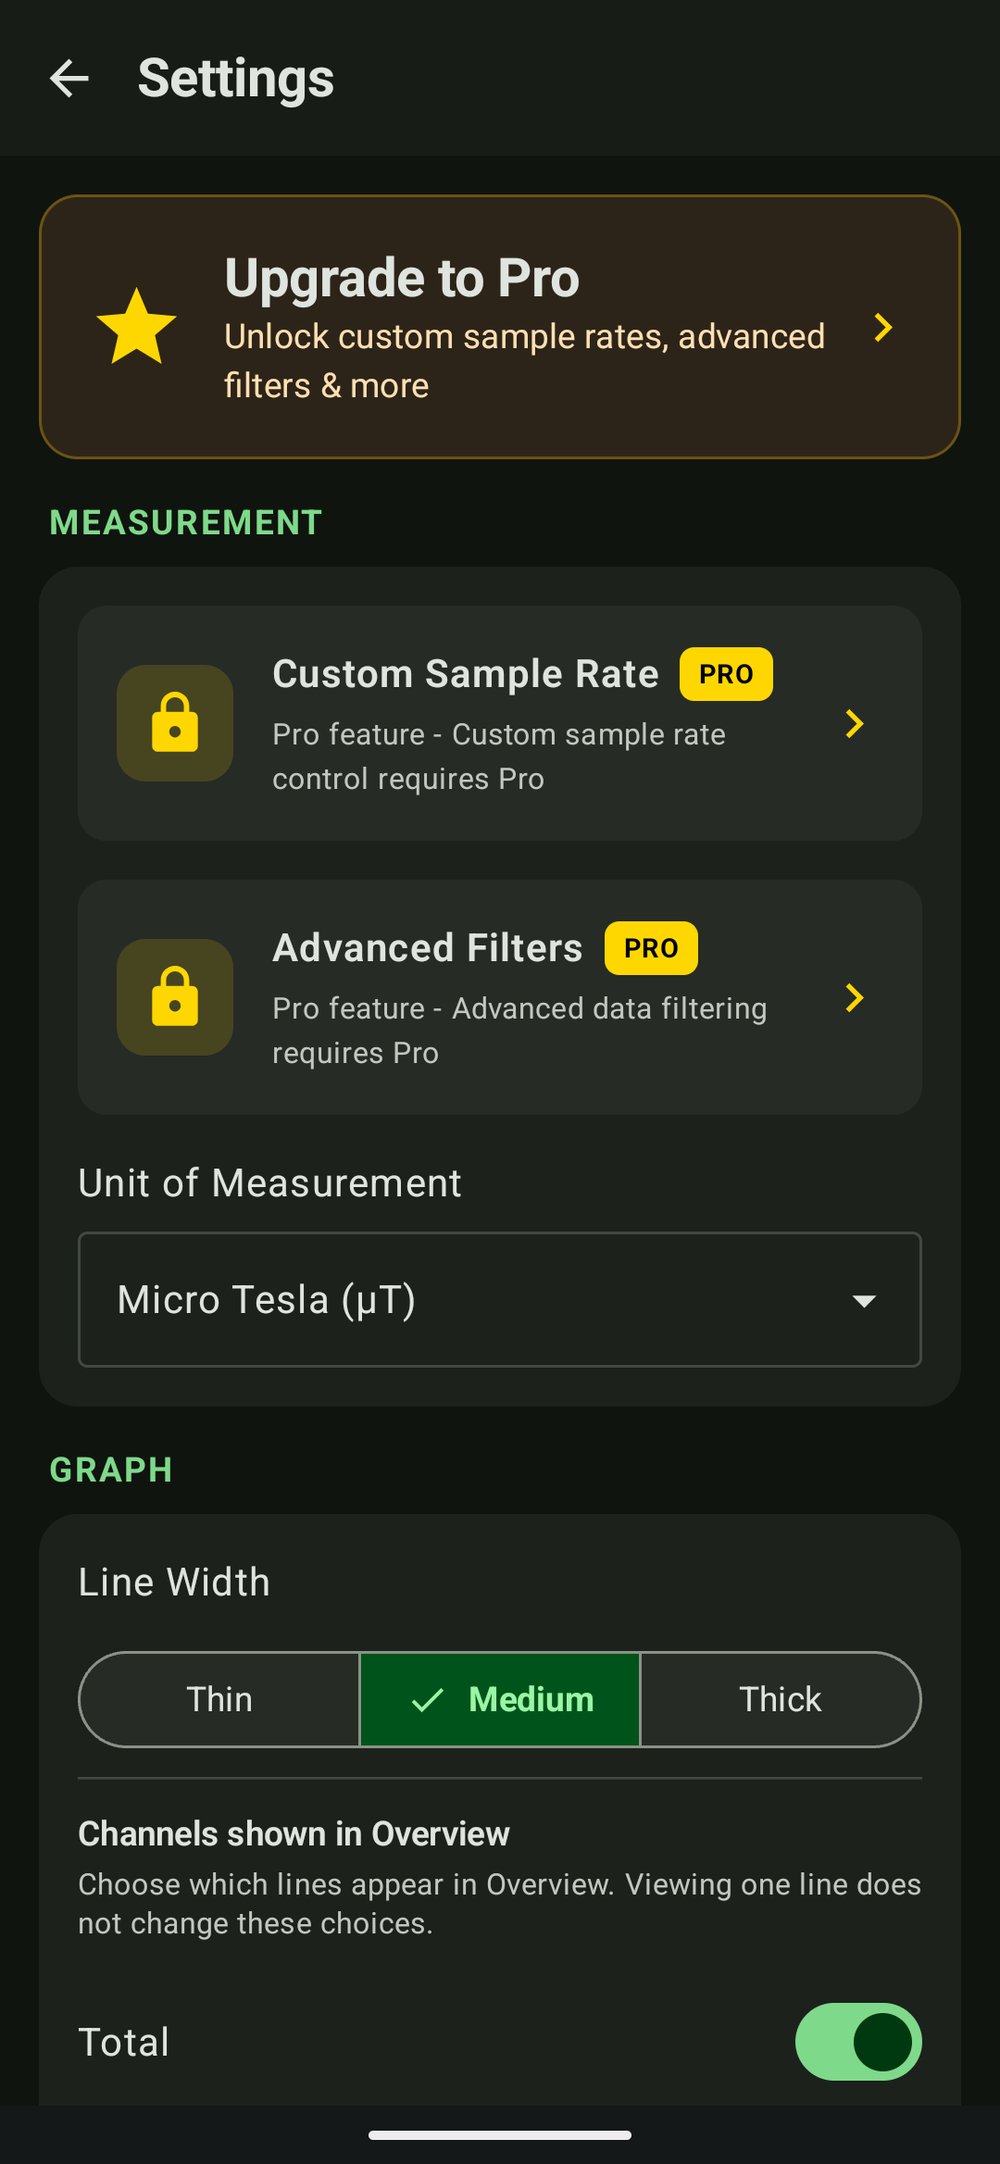
- Unit of Measurement. Tools that read a physical quantity, like the Magnetometer’s magnetic field or the Barometer’s pressure, let you switch the unit they’re shown in.
Graph
- Line Width. Thin, Medium, or Thick, shared across every tool.
- Show X / Y / Z / Total. On tools with more than one axis, choose which lines appear on the graph. Hiding a line doesn’t stop it from being recorded.
Recording
- Timestamp Format. Elapsed time, starting from zero, or Clock time, using the device’s current local time.
Class View
Turn on Class View to show that phone’s live reading on a classroom screen, no cables or extra software required. Join the same Wi-Fi as the classroom computer (or turn on the phone’s Personal Hotspot and have the computer join that), then type the address the phone shows into any web browser. Everyone watching sees the live reading and trace, and it follows whichever tool is open. Class View only works while the app is open, and anyone on the same network can view the page.